- Analisi
- Analisi Tecnica
Indice Azionario Australiano Analisi Tecnica - Indice Azionario Australiano Trading: 2019-08-06
World Stock Indices Down
Falling quotations are observed in almost all world stock markets. Will the australian stock index AU200 fall?
On Monday, August 5, 2019, the RMB rate collapsed and exceeded the psychological level of 7 yuan per US dollar, the first time since May 2008. This was a reaction to an increase in US import duties of 10% from September 1, 2019 on the supply of Chinese goods worth $ 300 billion a year. Investors regarded the actual devaluation of the renminbi as a significant increase in global risks and trade wars. All global stock indices fell, and gold quotes soared to a 6-year high. The Australian S&P/ ASX 200 on Monday showed the maximum daily drop in 7 months. China is Australia's main foreign trade partner with a share of about 30% of its exports. The problems of the Chinese economy can negatively affect the shares of Australian companies. The current P / E ratio (capitalization / net profit for the year) for the S&P/ ASX 200 is 17.2. Despite the decline in recent days, it is 17.6% higher than at the beginning of 2019.
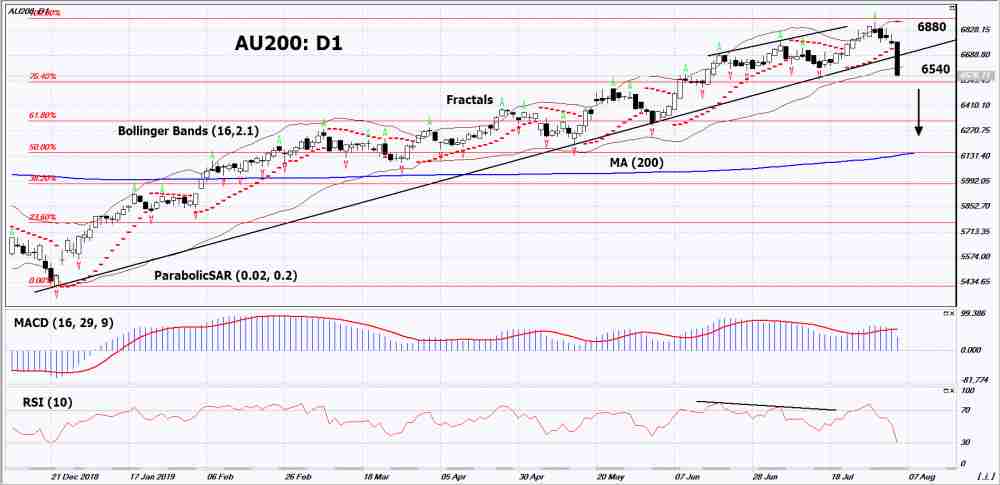
On a daily timeframe AU200: D1exeeded the growing trend and adjusted down. Most indicators of technical analysis formed a signal to decline. A drop in prices is possible in the event of a slowdown in the global and Australian economies.
- The Parabolic indicator demonstrates a downtrend signal.
- The Bolinger bands narrowed, indicating a decrease in volatility. The top line has a downward slope.
- The RSI indicator is below the 50 mark. No new divergence is observed.
- The MACD indicator gives a bearish signal.
The bearish momentum may develop if AU200 drops below the 1st Fibonacci level: 6540. This level can be used as an entry point. The initial stop loss may be placed higher than the last upper fractal, Parabolic signal, historical maximum and Bollinger upper line: 6880. After opening a pending order, stop shall be moved following the Bollinger and Parabolic signals to the next fractal maximum. Thus, we are changing the potential profit/loss to the breakeven point. More risk-averse traders may switch to the 4-hour chart after the trade and place a stop loss moving it in the direction of the trade. If the price meets the stop level (6880) without reaching the order (6540), we recommend to cancel the order: the market sustains internal changes that were not taken into account.
Technical Analysis Summary
| Position | Sell |
| Sell stop | Below 6540 |
| Stop loss | Above 6880 |
- Ottieni certificato

Note:
Questa panormaica è di carattere informativo-educativo e viene pubblicata gratuitamente. Tutti i dati compresi nella panoramica sono ottenuti da fonti pubbliche conosciute più o meno affidabili. Inoltre non c'è alcuna garanzia che le informazioni fornite siano precise e complete. Le panoramiche non vengono aggiornate. Tutta l'informazione in ciascuna panoramica, compresi indicatori, opinioni, grafici e o quant'altro, è fornita a scopo conoscitivo e non è un consiglio finanziario. Tutto il testo e qualsiasi delle sue parti, e anche i grafici non possono essere considerati un'offerta per effettuare un'operazione con un qualsiasi asset. IFC Markets e i suoi impiegati in alcun caso non sono responsabili per qualsiasi azione intrapresa sulla base delle informazioni contenute.
