- Analisi
- Analisi Tecnica
Rame Analisi Tecnica - Rame Trading: 2016-05-25
Lower copper surplus pushed prices up
Copper prices edged up on Tuesday as International Copper Study Group reported the global copper fell in February to 24 thousand tonnes from 51 thousand tonnes in January. In the first two months of 2016 the global surplus was 75 thousand tonnes which is far below the surplus of 134 thousand tonnes in the same period of 2015. Will the copper prices continue advancing?
Global copper demand is forecasted to be of 22.3mln tonnes this year with China accounting for 10.3mln tonnes, Eurozone for 3.3mln tonnes, US for 1.8mln tonnes and Japan for 1mln tonnes. Demand from China has a huge impact on copper prices. Market participants believe the demand may rise after China’s Ministry of Finance said the local authorities of China have to raise spending and make a hole in budget funds to stimulate economic growth. The next significant economic data are to come in China on June 1 – the manufacturing PMI.
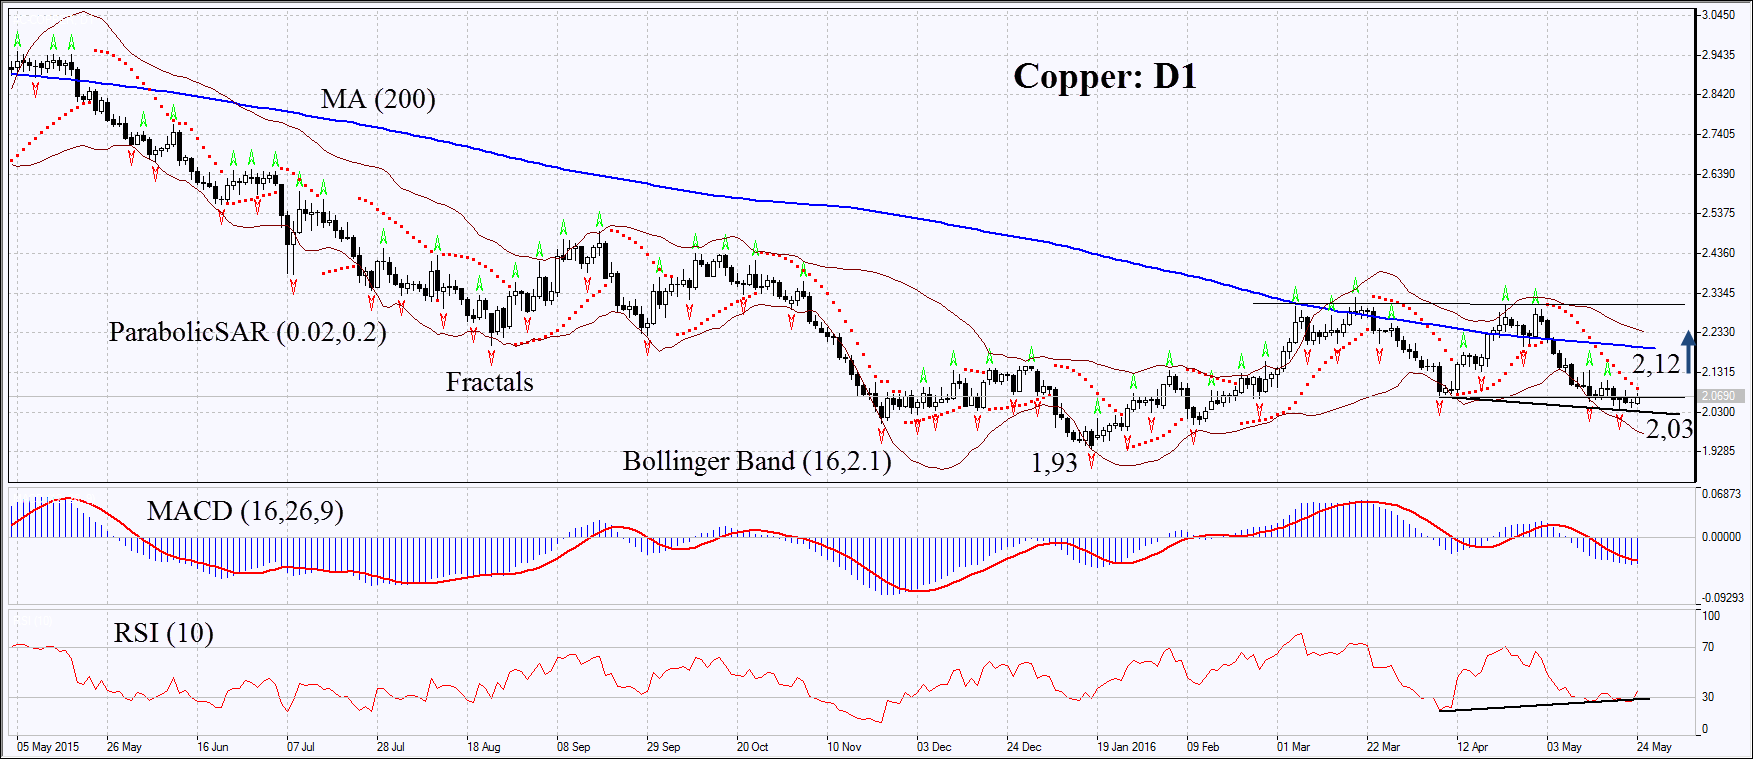
On the daily chart Copper: D1 has been consolidating for the 3rd week near the lower boundary of sideways channel. The RSI has formed positive divergence and is struggling for growth from the oversold zone. The MACD and Parabolic indicators did not reverse up yet and are giving signals to sell. The Bollinger bands have widened which is a bearish sign. They are tilted down. The bullish momentum may develop in case the copper rises from the consolidation zone, viz. surpasses the Parabolic signal and the last fractal high at 2.12. This level may serve the point of entry. The initial stop-loss may be placed below the last fractal low at 2.03. The most risk-averse traders may place it on the level of 7-year low of 1.93 hit early this year. Having opened the pending order we shall move the stop to the next fractal low following the Parabolic and Bollinger signals. Thus, we are changing the probable profit/loss ratio to the breakeven point. The most risk-averse traders may switch to the 4-hour chart after the trade and place there a stop-loss moving it in the direction of the trade. If the price meets the stop-loss level at 1.93 or 2.03 without reaching the order at 2.12, we recommend cancelling the position: the market sustains internal changes which were not taken into account.
| Position | Buy |
| Buy stop | above 2.12 |
| Stop loss | below 1.93 or 2.03 |
- Ottieni certificato

Note:
Questa panormaica è di carattere informativo-educativo e viene pubblicata gratuitamente. Tutti i dati compresi nella panoramica sono ottenuti da fonti pubbliche conosciute più o meno affidabili. Inoltre non c'è alcuna garanzia che le informazioni fornite siano precise e complete. Le panoramiche non vengono aggiornate. Tutta l'informazione in ciascuna panoramica, compresi indicatori, opinioni, grafici e o quant'altro, è fornita a scopo conoscitivo e non è un consiglio finanziario. Tutto il testo e qualsiasi delle sue parti, e anche i grafici non possono essere considerati un'offerta per effettuare un'operazione con un qualsiasi asset. IFC Markets e i suoi impiegati in alcun caso non sono responsabili per qualsiasi azione intrapresa sulla base delle informazioni contenute.
