- Analisi
- Analisi Tecnica
EU 50 50 Analisi Tecnica - EU 50 50 Trading: 2019-09-11
Accelerating euro area private sector activity bullish for EU50
Euro-zone’s private sector activity expansion was stronger than expected. Will the EU50 stock index continue advancing?
German strong trade data spurred hopes euro-zone economy is in better shape than feared. July trade surplus rose to 20.2 billion euro from 18.08 billion previous month when a smaller increase to 18.B billion was forecast. Stronger than expected German trade report followed an upgrade in euro-zone composite PMI: Markit’s final reading of composite PMI was revised upward to 51.9 for August from a preliminary reading of 51.8. The reading for July was 51.5. Accelerating expansion in euro-zone private sector activity for August is bullish for euro-zone stock market index.
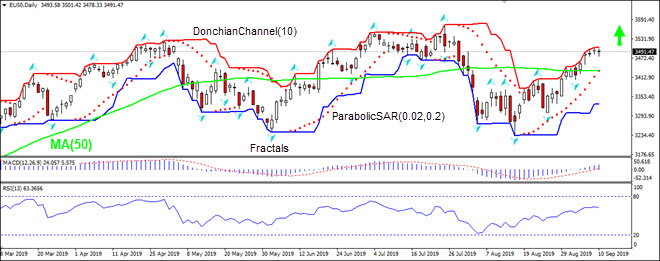
On the daily timeframe EU50: D1 is rising after breaking above 50-day moving average MA(50).
- The Donchian channel indicates no trend: it is flat.
- The Parabolic indicator has formed a buy signal.
- The MACD indicator is above the signal line and the gap is widening, which is a bullish signal.
- The RSI oscillator is above 50 level but has not reached the overbought zone.
We believe the bullish momentum will continue as the price breaches above the upper boundary of Donchian channel at 3505.18. This level can be used as an entry point for placing a pending order to buy. The stop loss can be placed below the fractal low at 3405.30. After placing the order, the stop loss is to be moved every day to the next fractal low, following Parabolic signals. Thus, we are changing the expected profit/loss ratio to the breakeven point. If the price meets the stop loss level (3405.30) without reaching the order (3505.18), we recommend cancelling the order: the market has undergone internal changes which were not taken into account.
Technical Analysis Summary
| Order | Buy |
| Buy stop | Above 3505.18 |
| Stop loss | Below 3405.30 |
- Ottieni certificato

Note:
Questa panormaica è di carattere informativo-educativo e viene pubblicata gratuitamente. Tutti i dati compresi nella panoramica sono ottenuti da fonti pubbliche conosciute più o meno affidabili. Inoltre non c'è alcuna garanzia che le informazioni fornite siano precise e complete. Le panoramiche non vengono aggiornate. Tutta l'informazione in ciascuna panoramica, compresi indicatori, opinioni, grafici e o quant'altro, è fornita a scopo conoscitivo e non è un consiglio finanziario. Tutto il testo e qualsiasi delle sue parti, e anche i grafici non possono essere considerati un'offerta per effettuare un'operazione con un qualsiasi asset. IFC Markets e i suoi impiegati in alcun caso non sono responsabili per qualsiasi azione intrapresa sulla base delle informazioni contenute.
