- Analisi
- Analisi Tecnica
EUR GBP Analisi Tecnica - EUR GBP Trading: 2019-03-12
Preparing for a new Brexit vote
On Tuesday, March 12, 2019, the House of Commons may vote on terms of the UK’s exit from the European Union. Is there a possibility for a big EURGBP change?
Such dynamics indicate the weakening of the euro and the strengthening of the British pound. On March 11, 2019, European Commission President Jean-Claude Juncker and British Prime Minister Theresa May had telephone negotiations. According to their results, Juncker declared that “the ball is now in UK’s court”. Theoretically, the European Parliament can ratify the version of the agreement for which the British parliament should vote now. Let us recall that the UK’s exit from the EU is scheduled for March 29, 2019. If the parliament does not agree with Brexit without an agreement with the European Union, then the actual release date can be postponed for several months. On Monday, the pound strengthened by almost 1% against the US dollar, as investors believe that either the Brexit date will be postponed, or the UK will enter into an agreement with the EU. Let us note that on March 12, significant macroeconomic statistics for January will come out in the UK: GDP, trade balance, industrial production. In turn, the euro shows a noticeable weakening after the ECB meeting held last week. In September 2019, the European regulator is going to launch a new asset purchase program TLTRO-3, which will last until March 2021. The purchase of assets will be conducted through the money emission (following the example of the US QE programs). The ECB explained the easing of its monetary policy by low Eurozone GDP growth and low inflation.
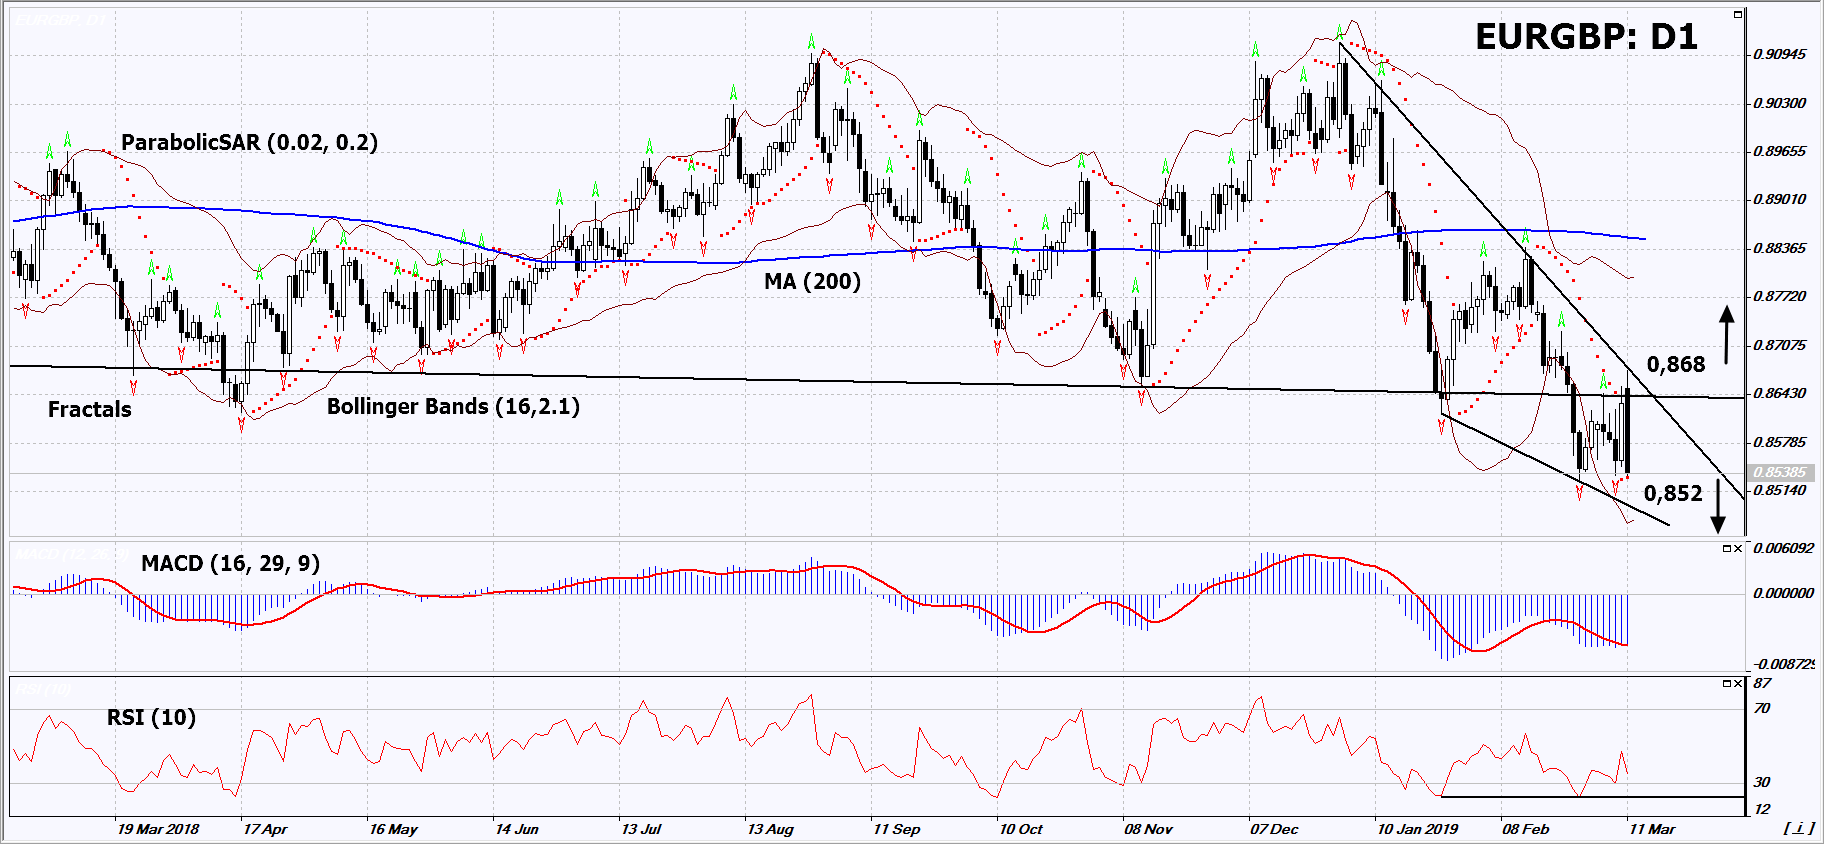
On the daily timeframe, EURGBP: D1 has again fallen below the lower boundary of the long-term neutral range. Before that, it tried to breached it up and return to the neutral range. The price decrease and the continuation of the downtrend is possible in case of the approval of the Brexit plan by the British Parliament, as well as in case of the publication of positive macroeconomic data in the UK and negative - in the Eurozone. Otherwise, the price increase is not excluded.
- The Parabolic Indicator gives a bullish signal. It can be used as an additional support level that should be breached down before opening a sell position.
- The Bollinger bands have widened, which indicates high volatility.
- The RSI indicator is near 50. It has formed a weak, positive divergence.
- The MACD indicator gives a bearish signal.
In our opinion, an impulse movement can be formed after the price rises and overcomes the last fractal high and the resistance line of the downtrend at 0.868 or, in case it falls below the two fractal lows and the Parabolic signal at 0.852. Let the market choose the movement scenario itself. Two or more positions can be placed in a symmetrical way: after opening one of the orders, the second order can be deleted - the market has chosen a direction. After opening the pending order, we shall move the stop to the next fractal high (short position) or low (long position) every 4 hours following the Parabolic signal. More risk-averse traders may switch to the 4-hour chart after the trade and place there a stop loss moving it in the direction of the trade. Thus, we are changing the potential profit/loss to the breakeven point. If the price meets the stop level without reaching the order, we recommend to close the position: the market sustains internal changes that were not taken into account.
| Position | Sell |
| Sell stop | Below 0.852 |
| Stop loss | Above 0.868 |
| Position | Buy |
| Buy stop | Above 0.868 |
| Stop loss | Below 0.852 |
- Ottieni certificato

Note:
Questa panormaica è di carattere informativo-educativo e viene pubblicata gratuitamente. Tutti i dati compresi nella panoramica sono ottenuti da fonti pubbliche conosciute più o meno affidabili. Inoltre non c'è alcuna garanzia che le informazioni fornite siano precise e complete. Le panoramiche non vengono aggiornate. Tutta l'informazione in ciascuna panoramica, compresi indicatori, opinioni, grafici e o quant'altro, è fornita a scopo conoscitivo e non è un consiglio finanziario. Tutto il testo e qualsiasi delle sue parti, e anche i grafici non possono essere considerati un'offerta per effettuare un'operazione con un qualsiasi asset. IFC Markets e i suoi impiegati in alcun caso non sono responsabili per qualsiasi azione intrapresa sulla base delle informazioni contenute.
