- Analisi
- Analisi Tecnica
Bovini giovani Analisi Tecnica - Bovini giovani Trading: 2019-07-01
Getting ready for the publication of the USDA report
U.S. The Department of Agriculture (USDA) reported that by the end of May this year, frozen beef stocks in the United States were 13% lower than the same period in 2018. Will the Fcattle quotations increase?
According to the USDA, the daily slaughter of cattle (cattle) in the United States last week amounted to 122 thousand heads, which is almost 2% more than last year. We also note that by June 1 of this year, the number of cattle in the US feedlots reached a historical maximum of 11.7 million heads, which was 2% on June 1, 2018. Meanwhile, in May, deliveries of cows to feedlots decreased by 3% from last year’s level. If this trend of reduction has lasted in June, then the livestock as of July 1 may decrease. This is able to push quotes up. June data will be published on July 19.
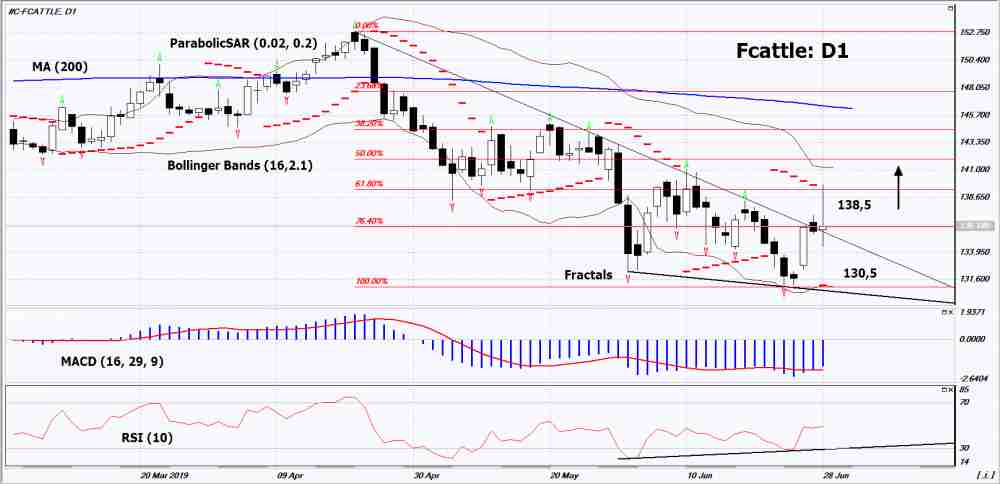
On the daily timeframe Fcattle: D1 broke up the downtrend resistance line. Various technical analysis indicators have generated uptrend signals. Further growth of quotations is possible in case of reduction in the number of cattle at feedlots in the USA.
- The Parabolic indicator indicates an uptrend signal.
- The Bolinger bands narrowed, indicating volatility decrease.
- The RSI indicator is near the 50 mark. It has formed a divergence to increase.
- The MACD indicator indicates bullish signal.
The bullish momentum may develop in case if Fcattle exceeds its last upper fractal: 138.5. This level can be used as an entry point. The stop loss can be placed lower than the last minimum (since April 2018), the Parabolic signal, the lower Bollinger line and the last lower fractal: 130.5. After placing the order, the stop loss shall be moved following the signals of Bollinger and Parabolic to the next fractal minimum. Thus, we are changing the potential profit/loss to the breakeven point. More risk-averse traders may switch to the 4-hour chart after the trade and place a stop loss moving it in the direction of the trade. If the price meets the stop level (130,5) without reaching the order (138,5), we recommend to cancel the order: the market sustains internal changes that were not taken into account.
Technical Analysis Summary
| Position | Buy |
| Buy stop | Above 138,5 |
| Stop loss | Below 130,5 |
- Ottieni certificato

Note:
Questa panormaica è di carattere informativo-educativo e viene pubblicata gratuitamente. Tutti i dati compresi nella panoramica sono ottenuti da fonti pubbliche conosciute più o meno affidabili. Inoltre non c'è alcuna garanzia che le informazioni fornite siano precise e complete. Le panoramiche non vengono aggiornate. Tutta l'informazione in ciascuna panoramica, compresi indicatori, opinioni, grafici e o quant'altro, è fornita a scopo conoscitivo e non è un consiglio finanziario. Tutto il testo e qualsiasi delle sue parti, e anche i grafici non possono essere considerati un'offerta per effettuare un'operazione con un qualsiasi asset. IFC Markets e i suoi impiegati in alcun caso non sono responsabili per qualsiasi azione intrapresa sulla base delle informazioni contenute.
