- Analisi
- Analisi Tecnica
FR 40 Analisi Tecnica - FR 40 Trading: 2015-07-07
Probable trend breakout
Today we would like to draw your attention to the FR40 CFD. It represents a French stock index, composed by analogy with Cotation Assistée en Continu (CAC40). It has the same assets distribution and contains the same stocks. The index is quoted with the euro. The quarter-to-quarter French GDP increased 0.6% as compared to the corresponding record for eurozone (0.4%). Yet, French economy used to lag behind the European one. We have been observing the constant eurozone GDP growth since the second quarter of 2013, while French GDP has merely started growing since the Q3, 2014. We do not expect the French economy to outperform the European Union. There has been trade deficit in France since 2004, while the EU have been showing trade balance surplus for 3 constant years. Trade balance for May was released in France on Tuesday. It appeared to be negative and did not meet expectations. There is an additional unfavorable factor – the debt/GDP ratio in France came close to 100%. Taking into consideration macroeconomic statistics, we suppose that FR40 will be moving in accordance with global and European trends – at least until better indices are published.
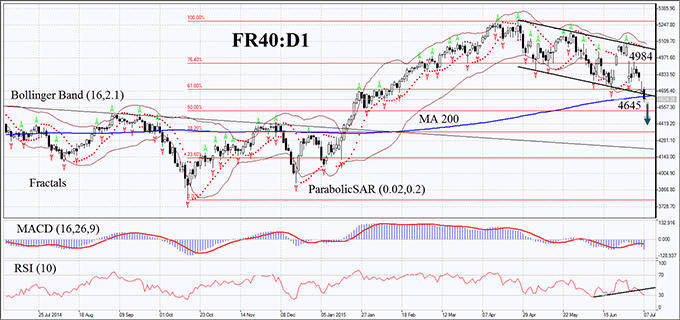
On the daily time frame FR40 has been traded lower for 2 consequent months. At the moment it is trying to breach the downtrend lower boundary, the 200-day moving Average and the Bollinger Band. If it succeeds, the bearish movement may accelerate. Parabolic and MACD have shaped sell signals. Bollinger Bands have expanded, which may indicate volatility growth and current trend consolidation. The bands have a negative slope as well. The RSI-Bars indicator has approached the oversold zone. Yet, its graph has formed a head-and-shoulders pattern. In theory it may confirm the current trend continuation. The further bearish momentum may develop if the latest FR40 bar closes below the 200-day Monthly Average at 4645. A stop loss may be placed above the daily gaps at 4984 or 4780. After pending order placing the stop loss is supposed to be moved every four hours near the next fractal high, following Bollinger and Parabolic signals. The most cautious traders are recommended to switch to the H4 time frame and place a stop loss, moving it after the trend. Thus, we are changing the probable profit/loss ratio to the breakeven point. If the price reaches the stop loss without triggering the order we recommend to cancel the position: the market sustains internal changes that were not considered.
| Position | Sell |
| Sell stop | below 4645 |
| Stop loss | above 4780 or 4984 |
- Ottieni certificato

Note:
Questa panormaica è di carattere informativo-educativo e viene pubblicata gratuitamente. Tutti i dati compresi nella panoramica sono ottenuti da fonti pubbliche conosciute più o meno affidabili. Inoltre non c'è alcuna garanzia che le informazioni fornite siano precise e complete. Le panoramiche non vengono aggiornate. Tutta l'informazione in ciascuna panoramica, compresi indicatori, opinioni, grafici e o quant'altro, è fornita a scopo conoscitivo e non è un consiglio finanziario. Tutto il testo e qualsiasi delle sue parti, e anche i grafici non possono essere considerati un'offerta per effettuare un'operazione con un qualsiasi asset. IFC Markets e i suoi impiegati in alcun caso non sono responsabili per qualsiasi azione intrapresa sulla base delle informazioni contenute.
