- Analisi
- Analisi Tecnica
GBP/CAD Analisi Tecnica - GBP/CAD Trading: 2019-08-20
Getting ready for important events
In this review, we suggest to consider the British pound against the Canadian dollar. Is the GBPCAD quotation growth possible? Such dynamics are observed with the weakening of the Canadian dollar and the strengthening of the British pound.
The main positive factor for the British pound is the possibility of concluding an agreement on Britain's exit from the European Union. Previously, the parties could not agree, which created high economic risks for the British economy and its currency. Recall that Brexit should be held on October 31, 2019. On August 24-26, 2019, the G7 summit will be held in France. British Prime Minister Boris Johnson intends to hold a series of meetings with European leaders as part of this event, starting with a meeting with French President Emmanuel Macron on August 22. In conclusion, he will hold talks with US President Donald Trump. If successful, the outcome of the visit of Boris Johnson may be a positive factor for the pound. In turn, important data on inflation for July will be published in Canada on August 21, 2019. It can affect the monetary policy of the Bank of Canada. Its next meeting will be held on September 4.
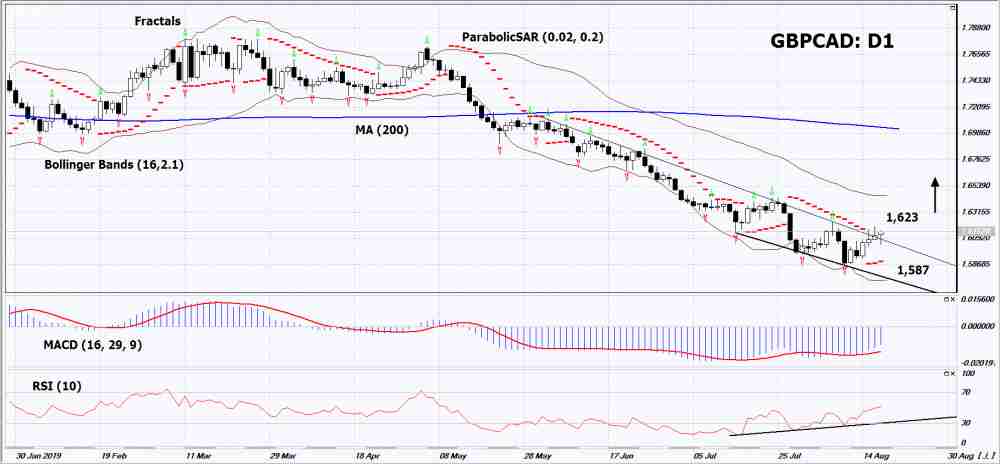
On the daily timeframe GBPCAD: D1 exceeded the downtrend. Further growth of quotes is possible in case of successful Brexit and a decrease of inflation in Canada.
- The Parabolic indicator demonstrates a signal to increase.
- The Bolinger bands widened, indicating high volatility. Both Bollinger Lines Slope Up.
- The RSI indicator is above the 50 mark. It has formed a triple divergence.
- The MACD indicator gives a bullish signal.
The bullish momentum may develop if GBPCAD exceeds its last upper fractal: 1.623. This level can be used as an entry point. The initial stop lose may be placed below the last lower fractal and the Parabolic signal: 1.587. After opening the pending order, the stop shall be moved following Bollinger and Parabolic signals to the next fractal minimum. Thus, we are changing the potential profit/loss to the breakeven point. More risk-averse traders may switch to the 4-hour chart after the trade and place a stop loss moving it in the direction of the trade. If the price meets the stop level (1,587) without reaching the order (1,623), we recommend to cancel the order: the market sustains internal changes that were not taken into account.
Technical Analysis Summary
| Position | Buy |
| Buy stop | Above 1,623 |
| Stop loss | Below 1,587 |
- Ottieni certificato

Note:
Questa panormaica è di carattere informativo-educativo e viene pubblicata gratuitamente. Tutti i dati compresi nella panoramica sono ottenuti da fonti pubbliche conosciute più o meno affidabili. Inoltre non c'è alcuna garanzia che le informazioni fornite siano precise e complete. Le panoramiche non vengono aggiornate. Tutta l'informazione in ciascuna panoramica, compresi indicatori, opinioni, grafici e o quant'altro, è fornita a scopo conoscitivo e non è un consiglio finanziario. Tutto il testo e qualsiasi delle sue parti, e anche i grafici non possono essere considerati un'offerta per effettuare un'operazione con un qualsiasi asset. IFC Markets e i suoi impiegati in alcun caso non sono responsabili per qualsiasi azione intrapresa sulla base delle informazioni contenute.
