- Analisi
- Analisi Tecnica
Bovino vivo Analisi Tecnica - Bovino vivo Trading: 2019-02-05
China can reduce beef consumption
All India Meat & Livestock Exporters Association expects a decrease in global demand for Indian beef. Will LCATTLE prices fall?
According to the forecast of this association, beef exports from India in the 2018/19 agricultural season may be reduced by 15% to 1.15 million tons. This is the minimum since the 2012/13 agricultural season. The main reason is the tightening of sanitary norms on beef imports in China because of the fear of a pangolin epidemic. Vietnam can also cut Indian beef purchases. Amid this, India is going to increase the supply of meat to such countries as Iraq, Malaysia, Indonesia and Egypt. The reduction in demand in China and Vietnam has already provoked a decline in Indian beef prices from $3.2 thousand per ton to $2.9 thousand. An additional factor for the possible price decrease may be an increase in cattle meat exports from Brazil in January 2019 to 102.4 thousand tons, compared with 99.4 thousand tons in January 2018.
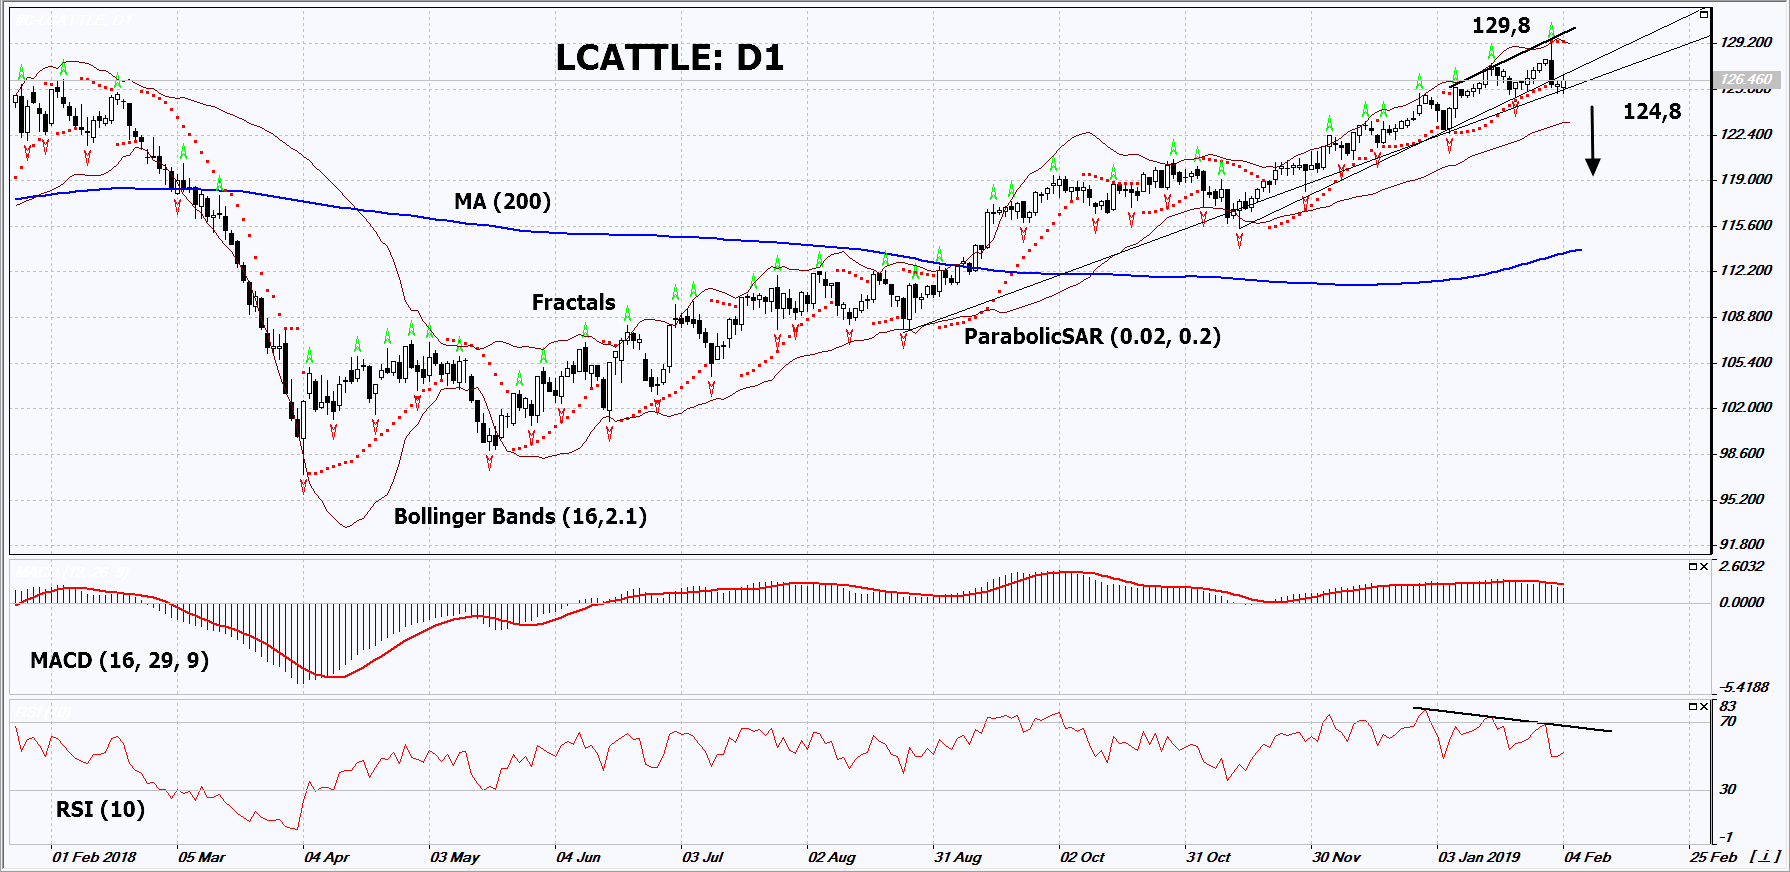
On the daily timeframe, LCATTLE: D1 has approached the support line of the uptrend. It should be breached down before opening a sell position. The price decrease is possible in case of a decline in global demand.
- The Parabolic indicator gives a bearish signal.
- The Bollinger bands have widened, which indicates high volatility. Both Bollinger bands are titled downwards
- The RSI indicator is near 50. It has formed a negative divergence.
- The MACD indicator gives a bearish signal.
The bearish momentum may develop in case LCATTLE falls below its last fractal low at 124.8. This level may serve as an entry point. The initial stop loss may be placed above the last fractal high, the high since November 2017, the upper Bollinger band and the Parabolic signal at 129.8. After opening the pending order, we shall move the stop to the next fractal low following the Bollinger and Parabolic signals. Thus, we are changing the potential profit/loss to the breakeven point. More risk-averse traders may switch to the 4-hour chart after the trade and place there a stop loss moving it in the direction of the trade. If the price meets the stop level (129.8) without reaching the order (124.8), we recommend to close the position: the market sustains internal changes that were not taken into account.
Summary of technical analysis
| Position | Sell |
| Sell stop | Below 124.8 |
| Stop loss | Above 129.8 |
- Ottieni certificato

Note:
Questa panormaica è di carattere informativo-educativo e viene pubblicata gratuitamente. Tutti i dati compresi nella panoramica sono ottenuti da fonti pubbliche conosciute più o meno affidabili. Inoltre non c'è alcuna garanzia che le informazioni fornite siano precise e complete. Le panoramiche non vengono aggiornate. Tutta l'informazione in ciascuna panoramica, compresi indicatori, opinioni, grafici e o quant'altro, è fornita a scopo conoscitivo e non è un consiglio finanziario. Tutto il testo e qualsiasi delle sue parti, e anche i grafici non possono essere considerati un'offerta per effettuare un'operazione con un qualsiasi asset. IFC Markets e i suoi impiegati in alcun caso non sono responsabili per qualsiasi azione intrapresa sulla base delle informazioni contenute.
