- Analisi
- Analisi Tecnica
Nasdaq Analisi Tecnica - Nasdaq Trading: 2019-03-14
Positive data bullish for Nd100
US retail sales and durable goods orders were better than expected. Will the Nd100 continue the rebound?
US economic releases after unexpectedly weak February jobs report were positive indicating the US economy remains strong. Durable goods orders recorded 0.4% over month increase in January when a 0.4% decline was forecast. Construction spending increase in January was also above forecast. The consumer price index rose 0.2% on month in February following three months of no change. A day before inflation data the Census Bureau reported above expected 0.2% rise over month in retail sales in January, after downwardly revised 1.6% drop in December. Better than expected economic data are bullish for Nd100 US stock index.
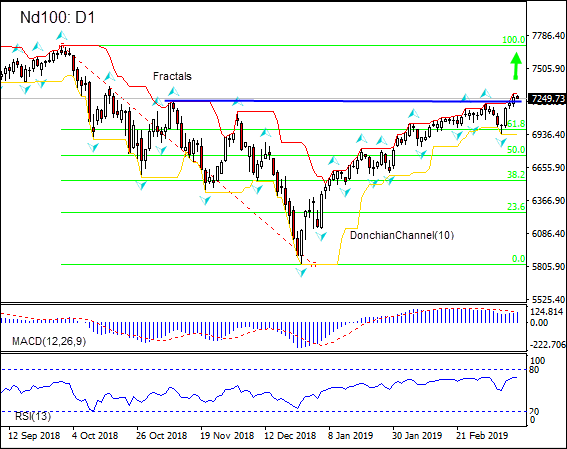
On the daily timeframe the Nd100: D1 has breached above the resistance line and has been rising after testing the Fibonacci 61.8 level. These are bullish.
- The Donchian channel indicates no trend yet: it is flat.
- The MACD indicator gives a bullish signal: it is above the signal line and the gap is widening.
- The RSI oscillator is rising but has not reached the overbought zone yet.
We believe the bullish momentum will continue after the price closes above the upper boundary of Donchian channel at 7292.22. This level can be used as an entry point for placing a pending order to buy. The stop loss can be placed below the fractal low at 6933.76. After placing the order, the stop loss is to be moved every day to the next fractal low. Thus, we are changing the expected profit/loss ratio to the breakeven point. If the price meets the stop loss level (6933.76) without reaching the order (7292.22), we recommend cancelling the order: the market has undergone internal changes which were not taken into account.
Technical Analysis Summary
| Position | Buy |
| Buy stop | Above 7292.22 |
| Stop loss | Below 6933.76 |
- Ottieni certificato

Note:
Questa panormaica è di carattere informativo-educativo e viene pubblicata gratuitamente. Tutti i dati compresi nella panoramica sono ottenuti da fonti pubbliche conosciute più o meno affidabili. Inoltre non c'è alcuna garanzia che le informazioni fornite siano precise e complete. Le panoramiche non vengono aggiornate. Tutta l'informazione in ciascuna panoramica, compresi indicatori, opinioni, grafici e o quant'altro, è fornita a scopo conoscitivo e non è un consiglio finanziario. Tutto il testo e qualsiasi delle sue parti, e anche i grafici non possono essere considerati un'offerta per effettuare un'operazione con un qualsiasi asset. IFC Markets e i suoi impiegati in alcun caso non sono responsabili per qualsiasi azione intrapresa sulla base delle informazioni contenute.
