- Analisi
- Analisi Tecnica
FMCG Stocks Analisi Tecnica - FMCG Stocks Trading: 2019-08-07
The cyclical nature of the American labor market may affect the dynamics of PCI.
In this review, we suggest to consider a personal composite instrument (PCI) Non-cyclical_Stocks - Stock Index Non-cyclic stocks. It reflects the price dynamics of a portfolio of 6 shares of the world's largest companies that produce consumer goods and services. Will the Non-cyclical_Stocks quotations fall?
After the announcement of new duties on Chinese goods, a correction began on the US stock market. Investors fear China’s retaliation and sanctions on US goods. Regarding American companies in the consumer sector, it can be noted that the unemployment rate in the US is now 3.7%. This is a minimum since 1969. The American labor market, as a rule, shows a cyclicality around an average level of 6%. In case of an increase in unemployment to the average historical level, the income of consumer companies may decrease.
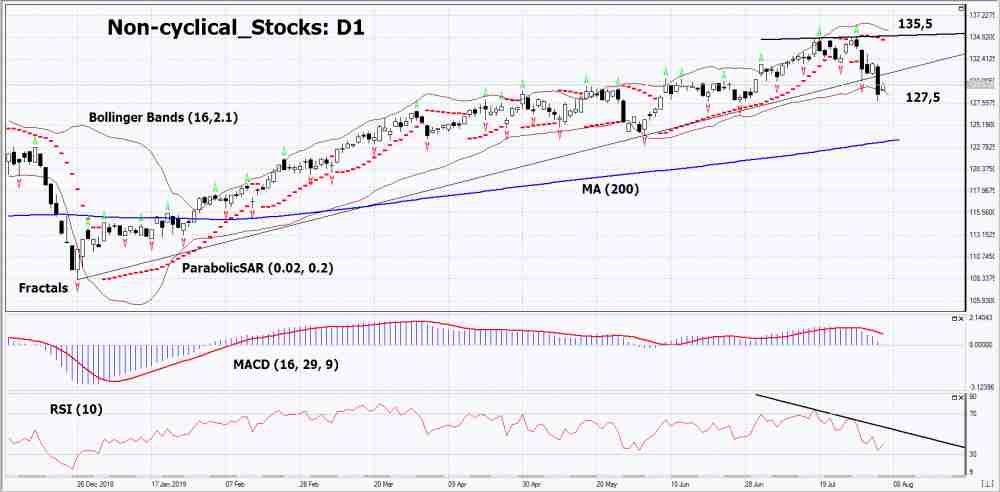
On the daily timeframe Non-cyclical_Stocks: D1 has broken down the uptrend support line. Technical analysis indicators formed a downtrend signal. Further downward correction is possible in case of publication of negative macroeconomic and corporate data.
- The Parabolic indicator demonstrates a downtrend signal.
- The Bolinger bands widened, indicating a volatility increase. Both Bollinger Lines Slope Down.
- The RSI indicator is below the 50 mark . It has formed a divergence to decrease.
- The MACD indicator gives a bearish signal.
The bearish momentum may develop if Non-cyclical_Stocks drops below its last low: 127.5. This level can be used as an entry point. The initial stop lose may be placed higher than the last upper fractal, historical high, Bollinger upper line and Parabolic signal: 135.5. After opening the pending order, the stop shall be moved following the signals of Bollinger and Parabolic to the next fractal minimum. Thus, we are changing the potential profit/loss to the breakeven point. More risk-averse traders may switch to the 4-hour chart after the trade and place a stop loss moving it in the direction of the trade. If the price meets the stop level (135,5) without reaching the order (127,5), we recommend to cancel the order: the market sustains internal changes that were not taken into account.
Technical Analysis Summary
| Position | Sell |
| Sell stop | Below 127,5 |
| Stop loss | Above 135,5 |
- Ottieni certificato

Note:
Questa panormaica è di carattere informativo-educativo e viene pubblicata gratuitamente. Tutti i dati compresi nella panoramica sono ottenuti da fonti pubbliche conosciute più o meno affidabili. Inoltre non c'è alcuna garanzia che le informazioni fornite siano precise e complete. Le panoramiche non vengono aggiornate. Tutta l'informazione in ciascuna panoramica, compresi indicatori, opinioni, grafici e o quant'altro, è fornita a scopo conoscitivo e non è un consiglio finanziario. Tutto il testo e qualsiasi delle sue parti, e anche i grafici non possono essere considerati un'offerta per effettuare un'operazione con un qualsiasi asset. IFC Markets e i suoi impiegati in alcun caso non sono responsabili per qualsiasi azione intrapresa sulla base delle informazioni contenute.
