- Analisi
- Analisi Tecnica
Nvidia Corp. Analisi Tecnica - Nvidia Corp. Trading: 2019-05-16
Lower sales expectations bearish for Nvidia price
Nvidia corporation is forecast to report first quarter revenue drop of over 30%. Will the Nvidia price continue declining?
Nvidia Corporation is expected to report first quarter revenue drop - more than 31% year over year to $2.2 billion. Among the reasons for the expected drop are weak graphics processing unit (GPU) demand and loss of Tesla business. NVIDIA's gaming business is its biggest source of revenue, accounting for about 43% of total sales. As a result, the company's earnings are expected to drop to $0.79 per share in the first quarter, down from $2.05 per share a year ago. Lower revenue forecast is bearish for Nvidia stock price. On the other hand, a surprise in the form of not such a sharp decline in revenue is an upside risk which might boost the stock price.
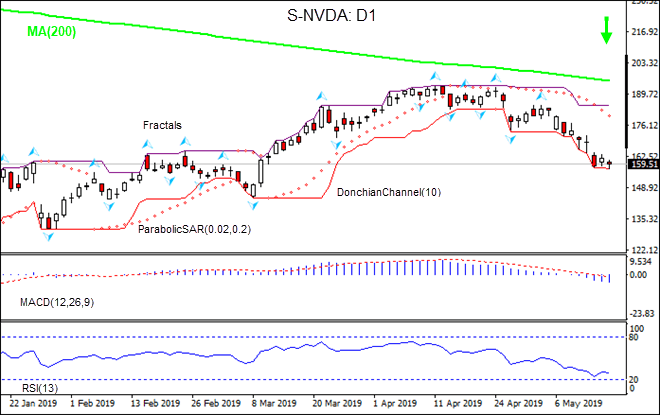
On the daily timeframe the S-NVDA: D1 is below the 200-day moving average MA(200) which is falling. This is bearish.
- The Parabolic indicator gives a sell signal.
- The Donchian channel indicates downtrend: it is tilted lower.
- The MACD indicator gives a bearish signal: it is below the signal line and the gap is widening.
- The RSI oscillator is falling but has not breached into the oversold zone yet.
We believe the bearish momentum will continue after the price breaches below the lower boundary of Donchian channel at 157.4. This level can be used as an entry point for placing a pending order to sell. The stop loss can be placed above the fractal high at 184.8. After placing the order, the stop loss is to be moved every day to the next fractal high, following Parabolic signals. Thus, we are changing the expected profit/loss ratio to the breakeven point. If the price meets the stop loss level (184.8) without reaching the order (157.4), we recommend cancelling the order: the market has undergone internal changes which were not taken into account.
Technical Analysis Summary
| Position | Sell |
| Sell stop | Below 157.4 |
| Stop loss | Above 184.8 |
- Ottieni certificato

Note:
Questa panormaica è di carattere informativo-educativo e viene pubblicata gratuitamente. Tutti i dati compresi nella panoramica sono ottenuti da fonti pubbliche conosciute più o meno affidabili. Inoltre non c'è alcuna garanzia che le informazioni fornite siano precise e complete. Le panoramiche non vengono aggiornate. Tutta l'informazione in ciascuna panoramica, compresi indicatori, opinioni, grafici e o quant'altro, è fornita a scopo conoscitivo e non è un consiglio finanziario. Tutto il testo e qualsiasi delle sue parti, e anche i grafici non possono essere considerati un'offerta per effettuare un'operazione con un qualsiasi asset. IFC Markets e i suoi impiegati in alcun caso non sono responsabili per qualsiasi azione intrapresa sulla base delle informazioni contenute.
