- Analisi
- Analisi Tecnica
Caffè Robusta Analisi Tecnica - Caffè Robusta Trading: 2018-12-26
World harvest forecasts may be excessively optimistic
Marex Spectron forecasts a global coffee deficit in the 2017/18 agricultural season in the amount of 1.7 million bags (60 kg). Will Robusta prices rise?
Previously, the US Department of Agriculture (USDA) published a very optimistic forecast for the world coffee harvest in the 2018/19 season. World production, according to the USDA, will be 174.5 million bags (60 kg), and consumption - 163.6 million. The difference will be used for increasing world reserves. Due to these expectations, in 2018, the cost of Robusta coffee fell by 16% to the low since March 2016. Now the dynamics of prices may strongly depend on weather.
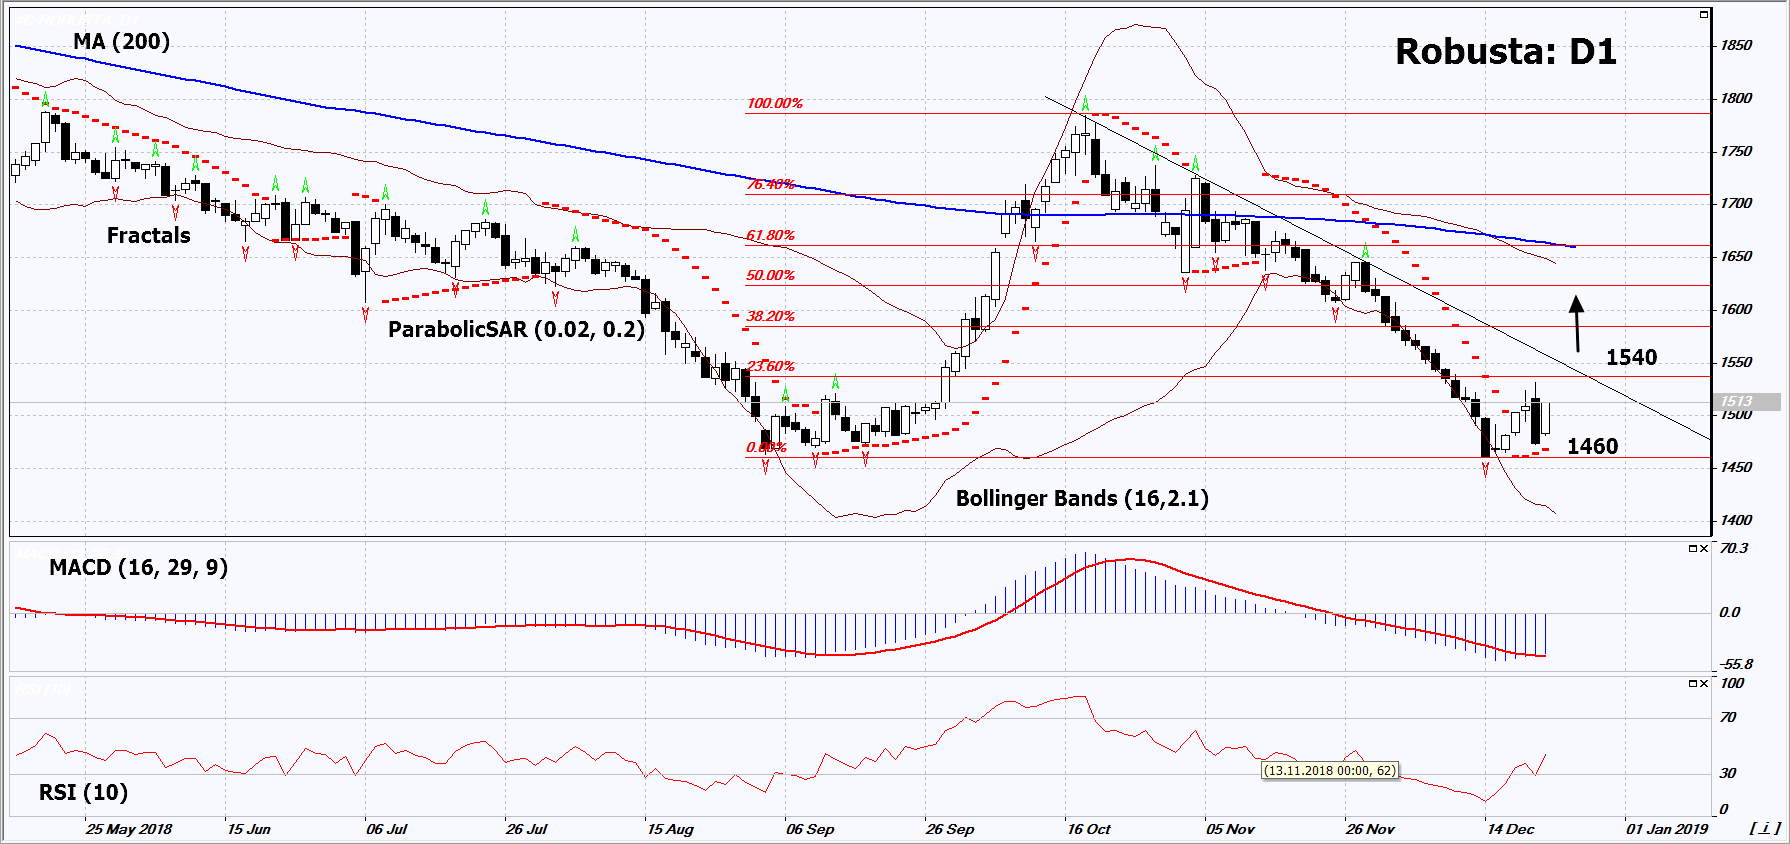
On the daily timeframe, Robusta: D1 remains in a downtrend. It has slowed down and a number of technical analysis indicators have formed buy signals. The further price correction is possible in case of a reduction in world harvest and an increase in demand.
- The Parabolic indicator gives a bullish signal.
- The Bollinger bands are widening strongly, which indicates high volatility.
- The RSI indicator is below 50. No divergence.
- The MACD indicator gives a bullish signal.
The bullish momentum may develop in case Robusta exceeds its last high and the 1st level of Fibonacci at 1540. This level may serve as an entry point. The initial stop loss may be placed below the last fractal low and the Parabolic signal at 1460. After opening the pending order, we shall move the stop to the next fractal low following the Bollinger and Parabolic signals. Thus, we are changing the potential profit/loss to the breakeven point. More risk-averse traders may switch to the 4-hour chart after the trade and place there a stop loss moving it in the direction of the trade. If the price meets the stop level (1460) without reaching the order (1540), we recommend to close the position: the market sustains internal changes that were not taken into account.
Summary of technical analysis
| Position | Buy |
| Buy stop | Above 1540 |
| Stop loss | Below 1460 |
- Ottieni certificato

Note:
Questa panormaica è di carattere informativo-educativo e viene pubblicata gratuitamente. Tutti i dati compresi nella panoramica sono ottenuti da fonti pubbliche conosciute più o meno affidabili. Inoltre non c'è alcuna garanzia che le informazioni fornite siano precise e complete. Le panoramiche non vengono aggiornate. Tutta l'informazione in ciascuna panoramica, compresi indicatori, opinioni, grafici e o quant'altro, è fornita a scopo conoscitivo e non è un consiglio finanziario. Tutto il testo e qualsiasi delle sue parti, e anche i grafici non possono essere considerati un'offerta per effettuare un'operazione con un qualsiasi asset. IFC Markets e i suoi impiegati in alcun caso non sono responsabili per qualsiasi azione intrapresa sulla base delle informazioni contenute.
