- Analisi
- Analisi Tecnica
Portafoglio di azioni nel settore High-Tech Analisi Tecnica - Portafoglio di azioni nel settore High-Tech Trading: 2017-05-23
Will the historic high be exceeded?
In this review, we recommend considering the personal composite instrument (PCI) Technology_Stocks . It reflects the dynamics of the portfolio from 10 stocks of the largest US companies from the high-tech industry, traded on NASDAQ and NYSE stock exchanges.
The main negative for the US Stock market may become the delay of implementation of the US President Donald Trump's economic program to support the largest corporations. For the last 4 years, the PCI Technology_Stocks has grown 2 times. It looks overvalued by fundamental and technical indicators.
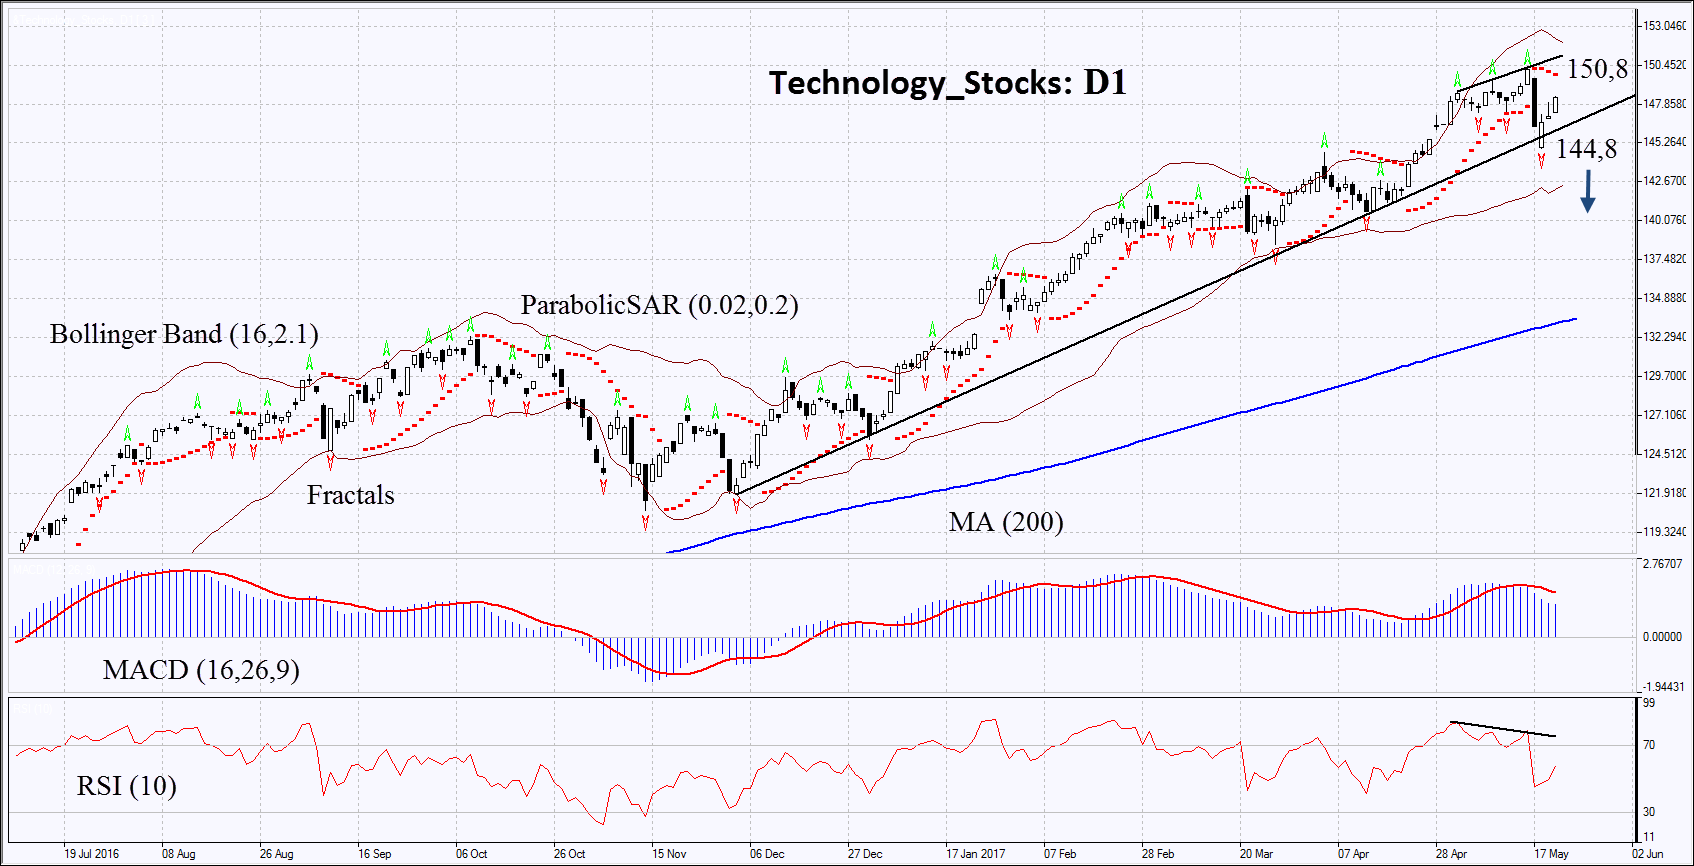
On the daily timeframe, Technology_Stocks: D1 is in an ascending channel. The growth of quotations slowed down and the indicators of technical analysis formed signals to sell. The PCI correction is possible in case of the publication of weak financial data of the companies from its list, as well as, in case of a decline in the US stock market.
- The Parabolic indicator gives a bearish signal.
- The Bollinger bands have widened, which means high volatility.
- The RSI indicator is above 50. It has formed a negative divergence.
- The MACD indicator is giving bearish signals.
The bearish momentum may develop in case Technology_Stocks falls below the last fractal low at 144,8. This level may serve as an entry point. The initial stop-loss may be placed above the last fractal high, the historic high and the Parabolic signal at 150,8. After opening the pending order, we shall move the stop to the next fractal high following the Bollinger and Parabolic signals. Thus, we are changing the potential profit/loss to the breakeven point. More risk-averse traders may switch to the 4-hour chart after the trade and place there a stop-loss moving it in the direction of the trade. If the price meets the stop level at 150,8 without reaching the order at 144,8, we recommend cancelling the position: the market sustains internal changes that were not taken into account.
Summary of technical analysis
| Position | Sell |
| Sell stop | below 144,8 |
| Stop loss | above 150,8 |
- Ottieni certificato

Note:
Questa panormaica è di carattere informativo-educativo e viene pubblicata gratuitamente. Tutti i dati compresi nella panoramica sono ottenuti da fonti pubbliche conosciute più o meno affidabili. Inoltre non c'è alcuna garanzia che le informazioni fornite siano precise e complete. Le panoramiche non vengono aggiornate. Tutta l'informazione in ciascuna panoramica, compresi indicatori, opinioni, grafici e o quant'altro, è fornita a scopo conoscitivo e non è un consiglio finanziario. Tutto il testo e qualsiasi delle sue parti, e anche i grafici non possono essere considerati un'offerta per effettuare un'operazione con un qualsiasi asset. IFC Markets e i suoi impiegati in alcun caso non sono responsabili per qualsiasi azione intrapresa sulla base delle informazioni contenute.
