- Analisi
- Analisi Tecnica
Grano Analisi Tecnica - Grano Trading: 2019-02-06
Wheat reserves fell in Canada
The national statistical agency Statistics Canada reported a reduction in Canadian wheat reserves. Will Wheat prices rise?
In December 2018, total wheat reserves in Canada amounted to 23.2 million tons. This is by 0.2% less than the level of December 2017 and by 3.6% - the level of December 2016. An additional factor for the growth may be the results of an international tender to purchase wheat, announced by Jordan in the amount of 120 thousand tons. However, it could purchase only half of the desired - 60 thousand tons. Theoretically, this may be a sign of insufficient supply of grain in the world market. Now the Ministry of Agriculture of Japan announced a tender to purchase 131.2 thousand tons of wheat. Its results may be announced on Thursday. On Friday, February 8, the US Department of Agriculture will publish forecasts on US and world reserves of corn, soybeans and wheat, as well as other data at 17-00 GMT. This information may affect quotations, especially, taking into account the already announced decline in wheat reserves in Canada.
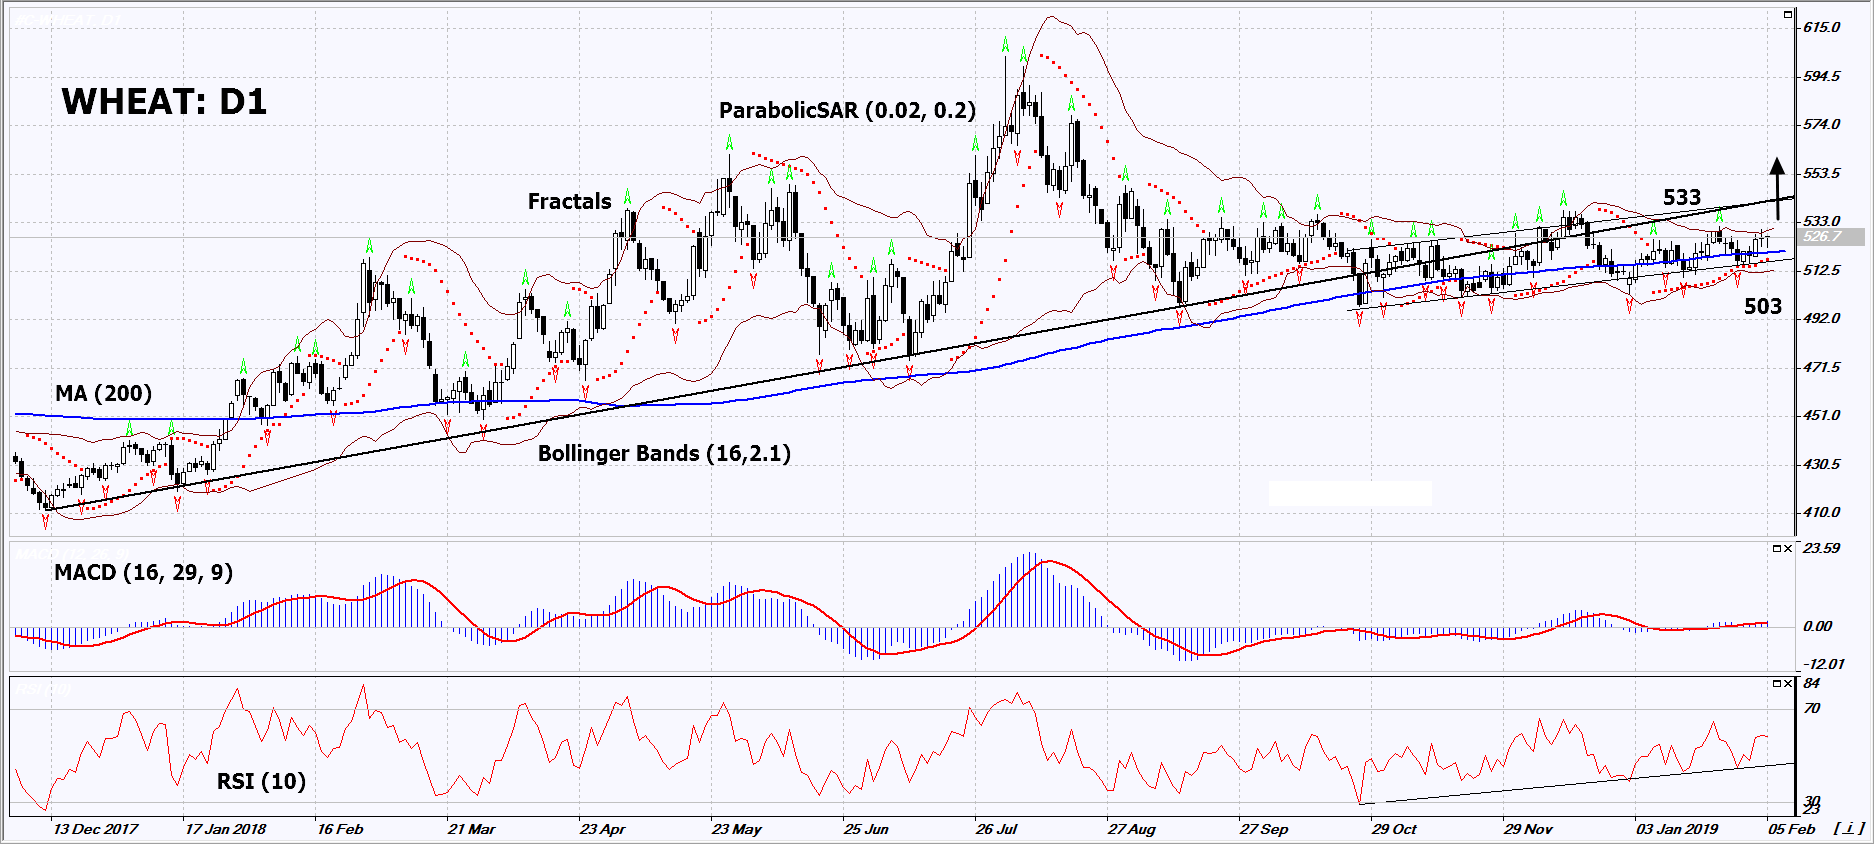
On the daily timeframe, Wheat: D1 is in a long-term uptrend. A number of technical analysis indicators formed buy signals. The further price growth is possible in case of an increase in world demand amid a decrease in reserves of producing countries.
- The Parabolic indicator gives a bullish signal.
- The Bollinger bands have narrowed, which indicates low volatility. Both Bollinger bands are titled upwards.
- The RSI indicator is above 50. No divergence.
- The MACD indicator gives a bullish signal.
The bullish momentum may develop in case Wheat exceeds its last fractal high and the upper Bollinger band at 533. This level may serve as an entry point. The initial stop loss may be placed below the 4 last fractal lows, the Parabolic signal and the lower Bollinger band at 503. After opening the pending order, we shall move the stop to the next fractal low following the Bollinger and Parabolic signals. Thus, we are changing the potential profit/loss to the breakeven point. More risk-averse traders may switch to the 4-hour chart after the trade and place there a stop loss moving it in the direction of the trade. If the price meets the stop level (503) without reaching the order (533), we recommend to close the position: the market sustains internal changes that were not taken into account.
Summary of technical analysis
| Position | Buy |
| Buy stop | Above 533 |
| Stop loss | Below 503 |
- Ottieni certificato

Note:
Questa panormaica è di carattere informativo-educativo e viene pubblicata gratuitamente. Tutti i dati compresi nella panoramica sono ottenuti da fonti pubbliche conosciute più o meno affidabili. Inoltre non c'è alcuna garanzia che le informazioni fornite siano precise e complete. Le panoramiche non vengono aggiornate. Tutta l'informazione in ciascuna panoramica, compresi indicatori, opinioni, grafici e o quant'altro, è fornita a scopo conoscitivo e non è un consiglio finanziario. Tutto il testo e qualsiasi delle sue parti, e anche i grafici non possono essere considerati un'offerta per effettuare un'operazione con un qualsiasi asset. IFC Markets e i suoi impiegati in alcun caso non sono responsabili per qualsiasi azione intrapresa sulla base delle informazioni contenute.
