- Analisi
- Analisi Tecnica
Oro Argento Analisi Tecnica - Oro Argento Trading: 2019-07-17
Silver rises in price against gold
The gold to silver ratio is adjusted down from the historical maximum. Will the decline of XAUXAG quotations continue?
Such dynamics is observed when gold becomes cheaper, and silver becomes more expensive. The cost of gold fell against the strengthening of the dollar after the publication of good macroeconomic indicators in the United States. Growth in retail sales in June exceeded forecasts and amounted to + 0.4% compared with June. Year to year, retail sales grew by 3.4%. Positive US statistics may limit the potential rate cut by the Fed. Silver quotations, on the contrary, soared yesterday a 4-month high. Some very important reasons for this growth have not been voiced. However, it can be noted that for 10 years the world balance of silver has a stable annual deficit, covered by global reserves. So, in 2018, the global deficit was 80 million ounces. In addition, investors have noted an increase in demand for investment coins and silver bars against the background of sharply rising gold.
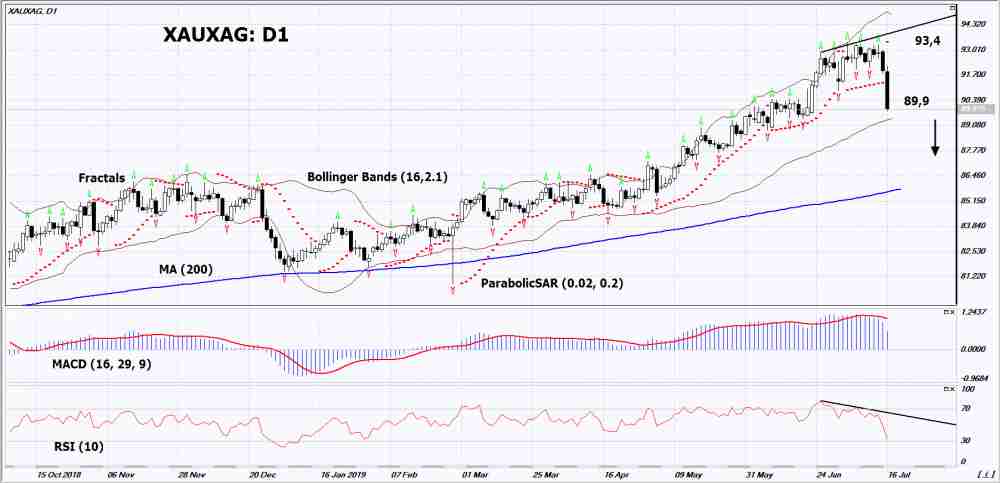
On the daily timeframe XAUXAG: D1 adjusted from the historical maximum. Various technical analysis indicators formed bearish signal. Decrease in quotations is possible if high demand for silver remains.
- The Parabolic indicator indicates signal to decrease.
- The Bolinger bands expanded, indicating a volatility decrease. The top line slopes down.
- The RSI indicator is below 50. It has formed a divergence to decrease.
- The MACD indicator gives bearish signal.
The bearish momentum may develop if XAUXAG drops below its last low: 89.9. This level can be used as an entry point. The initial stop lose may be placed above the last three upper fractals, the historical maximum and the Parabolic signal: 93.4. After opening the pending order, stop shall be moved following the the Bollinger and Parabolic signals to the next fractal minimum. Thus, we are changing the potential profit/loss to the breakeven point. More risk-averse traders may switch to the 4-hour chart after the trade and place a stop loss moving it in the direction of the trade. If the price meets the stop level (93,4) without reaching the order (89,9), we recommend to cancel the order: the market sustains internal changes that were not taken into account.
Technical Analysis Summary
| Position | Sell |
| Sell stop | Below 89,9 |
| Stop loss | Above 93,4 |
- Ottieni certificato

Note:
Questa panormaica è di carattere informativo-educativo e viene pubblicata gratuitamente. Tutti i dati compresi nella panoramica sono ottenuti da fonti pubbliche conosciute più o meno affidabili. Inoltre non c'è alcuna garanzia che le informazioni fornite siano precise e complete. Le panoramiche non vengono aggiornate. Tutta l'informazione in ciascuna panoramica, compresi indicatori, opinioni, grafici e o quant'altro, è fornita a scopo conoscitivo e non è un consiglio finanziario. Tutto il testo e qualsiasi delle sue parti, e anche i grafici non possono essere considerati un'offerta per effettuare un'operazione con un qualsiasi asset. IFC Markets e i suoi impiegati in alcun caso non sono responsabili per qualsiasi azione intrapresa sulla base delle informazioni contenute.
